
If you use Twitter, you should be taking advantage of its analytics platform to help you find out what your most effective content on Twitter is.
Here’s how to get started with Twitter Analytics and make smarter marketing decisions:
First, go to analytics.twitter.com and log in using your regular Twitter credentials.
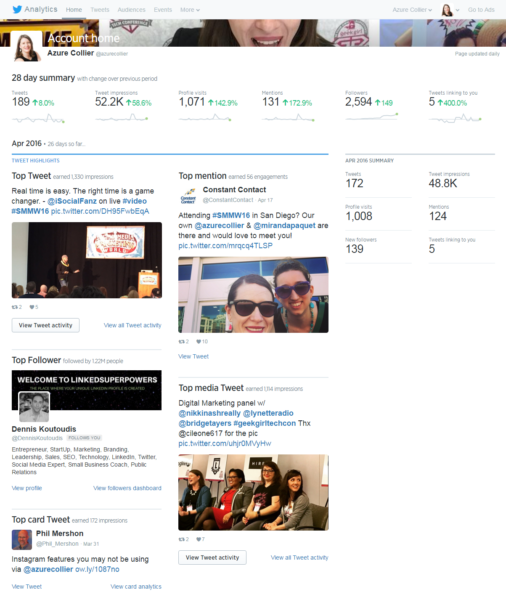
The first section you’ll see is your account home, which will give you a 28-day summary of how many tweets you’ve posted, the number of impressions those tweets received, how many visits were made to your profile, the number mentions you got, your current follower count, and how many tweets have been created that link to your profile.
Below the summary are highlights for each month. These include your top tweet, mention, follower, media tweet and card tweet, as well as summaries. Here’s an example from my personal Twitter account, @azurecollier:
Tweet activity
You can take a closer look at your content by clicking “Tweets” in the Twitter analytics menu. In this section, Twitter displays analytics for your tweets over the last 28 days, but you can select a different time period by clicking the Last 28 Days button on the top right side of the page.
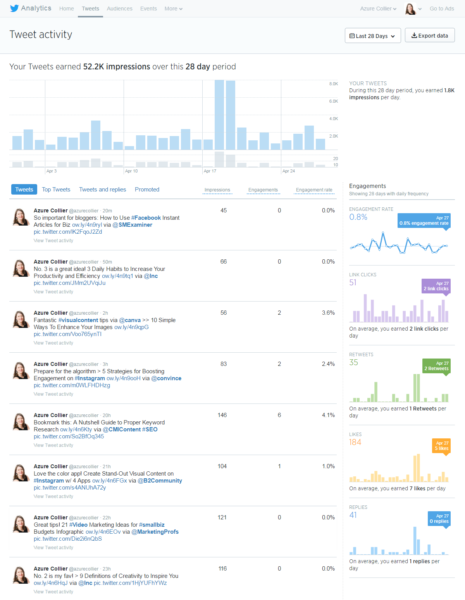
The graph at the top shows you the number of impressions and tweets by day. Below the graph, you can click through a menu of your tweets arranged by four categories:
- Tweets – your tweets in reverse-chronological order
- Top tweets – the tweets that got the most impressions
- Tweets and replies – your tweets and replies by other Twitter users
- Promoted – any promoted tweets that you published)
Twitter will also show metrics for each tweet:
- Impressions – the number of times a user is served a Tweet in timeline or search results
- Engagements – the total number of times a user has interacted with a tweet, includes clicks, retweets, replies, follows, likes, links, Twitter cards, hashtags, embedded media, Twitter username, profile photo or expanding the tweet
- Engagement rate – the number of engagements divided by the number of impressions
Overall engagement metrics for the time period you select can be found on the right side of the tweets. These graphs show the engagement rate, number of link clicks, number of retweets, number of likes, and number of replies per day and on average over the time period.
How to use your tweet activity metrics
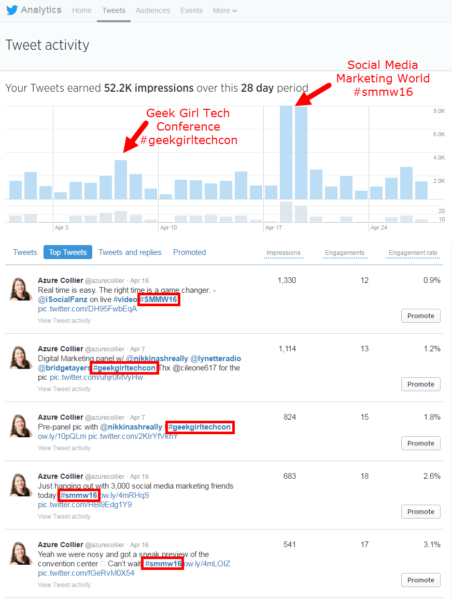
If you see spikes in your impressions, revisit the content you shared on those days to see what got the most impressions. For example, I can see that the top three spikes happened during the days I attended and spoke at Geek Girl Camp and at Social Media Marketing World. I participated in the conversations surrounding these conferences by tweeting and using the events’ hashtags.
Clicking on the top tweets category confirms my guess. You can see from this screenshot that my top tweets were from those events.
But don’t stop there. Check the engagement metrics for more information on what content is working for you on Twitter. Find the tweets in your top tweets that got the most engagement and compare them with your overall engagement metrics and the days that got the best engagement for each type.
Or you can export this data by clicking the export data button at the top of the Tweet activity page to get complete metrics and find out how many times Twitter users clicked links, retweeted, liked, and replied to each tweet.
Audiences
The Audiences tab in Twitter’s analytics platform provides you with a wealth of data about the people who follow your Twitter profile. When you go to the audience insights page, you’ll get an overall view of your follower growth for the past 90 days and information about your current audience.
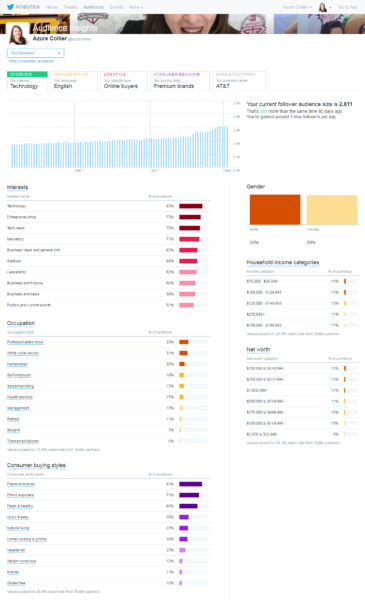
When I look at my audience insights overview page, I can see that a majority of my followers are interested in technology, business, and marketing, which is exactly the kind of content I tweet about.
How to use your audience metrics
Dig deeper into these metrics by clicking through the tabs on the top of the audience insights page to learn more about the demographics, lifestyle, consumer behavior, and mobile footprint of your followers. This information can help you figure out what kind of information your audience might be interested in so you can create and share relevant content.
The demographics section will show you the gender, occupation, region, and income of your Twitter followers. The lifestyle tab shares information like interests, TV genres and political party affiliation of your followers.
Consumer behavior is a tab your business should watch closely for information on your followers’ buying styles (such as premium brands, fresh & healthy, or natural living) and the kinds of purchases they make (types of food and retail products). Check these sections regularly to determine if your business is reaching your ideal audience on Twitter.
Use Twitter analytics to take your tweets to the next level
When you spend some time reviewing your Twitter analytics, you’ll begin to notice trends that point to what Twitter content is working, what’s not working, and how to relate to your audience based on insights. These lessons will help you get the most out of Twitter for your business.
Looking for more online marketing advice?
Subscribe to our newsletter! Our Hints & Tips newsletter delivers the practical marketing tips and tricks you need to grow your business. Sign up to receive a roundup of our best blog posts, webinars, and resources — delivered straight to your inbox twice each month.


